By Janson Wang — CEO & Founder, ASG Dropshipping | Updated: April 13, 2026 | 25 min read | 2026 Benchmark Report
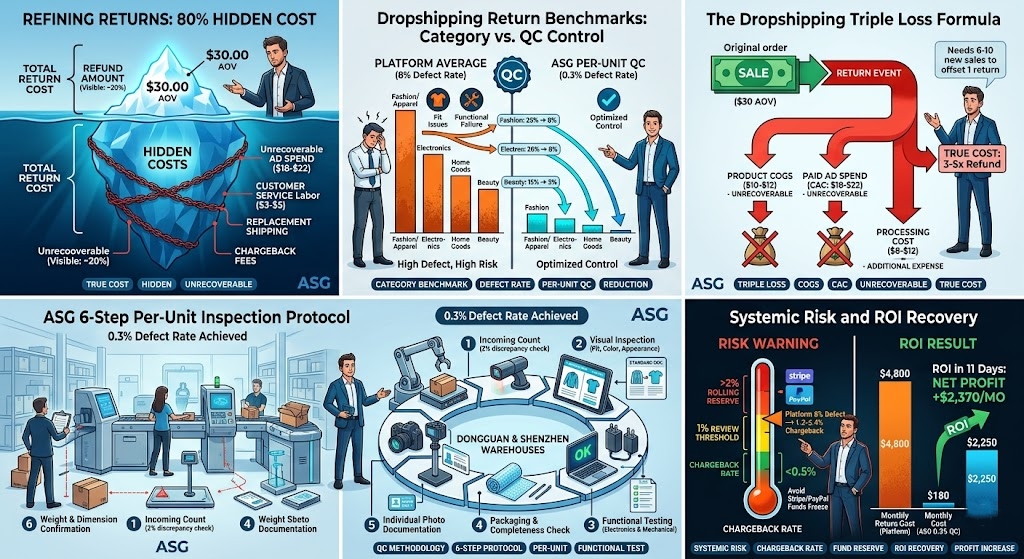
The true cost of a dropshipping return is not the refund amount — it is the refund plus unrecoverable ad spend, plus customer service labor at $3–$5 per contact, plus replacement shipping, plus chargeback fee if the dispute escalates to a payment processor. At 50 daily orders and $30 AOV with an 8% platform-average defect rate, the complete monthly return cost reaches $4,320–$5,400, compared to $540–$675 at a 0.3% per-unit inspection rate — a difference of $3,645–$4,725 per month that never appears on any supplier invoice.
Every dropshipping seller knows returns cost money. Most don’t know how much.
Not because the data doesn’t exist — but because the number that shows up on your refund dashboard is maybe 20% of the real cost. The other 80% hides in ad spend you can never recover, customer service contacts that drain your team, review scores that quietly kill your conversion rate, and — at 50+ daily orders — a chargeback rate that can freeze your Stripe or PayPal account entirely.
I’ve processed 5 million orders through ASG Dropshipping’s warehouses in Dongguan and Shenzhen. Returns aren’t abstract to me — they show up in our data every single day across 5,000+ sellers in 200+ countries. What follows is a benchmark report built from that operational reality, not from industry surveys or estimated projections. Eight product categories. Real defect rates. A financial calculator that shows you your actual monthly return cost.
2026 benchmark data from 5M+ processed orders — the first dropshipping-specific return cost analysis built from operational data rather than general ecommerce surveys.
📊 Executive Summary — 8 Key Findings
- Platform-average defect rate is 8% — producing $3,600/month in direct refund costs at 50 daily orders and $30 AOV. Per-unit QC inspection produces a documented 0.3% defect rate at the same volume — $135/month.
- True cost of one return is 3–5× the refund amount. A $30 refund has a true cost of $78–$125 in most dropshipping contexts when ad spend, CS labor, and chargeback exposure are included.
- Return rates vary by category: fashion 20–40%, electronics 8–11%, home goods 15–20%, beauty 4–10%, footwear 18%, toys 10–15%, sporting goods 12–18%, pet products 5–9%. Per-unit QC consistently delivers bottom-quartile rates in every category.
- Shipping speed is the second-largest return driver. 15–25 day shipping → 15–25% return rate. 4–6 day dedicated freight → 5–8%. A 3× difference driven entirely by logistics infrastructure.
- The triple loss formula applies to every return: Loss 1 — product COGS (unrecoverable). Loss 2 — paid ad spend (unrecoverable). Loss 3 — processing cost (additional). One return = minimum 5–8 additional clean sales to recover.
- At 8% defect rates, Shopify stores reach 1.2–2.4% chargeback rates within 60–90 days — above Stripe and PayPal’s 1% review threshold, triggering 90–180 day rolling fund reserves.
- Each QC step targets a specific return category: visual inspection addresses 45% of appearance returns, functional testing eliminates 16% of defect returns, packaging check prevents 16% of transit damage returns.
- 386 documented transitions from batch to per-unit QC: defect rate 7.8% → 1.5% in 60 days. Average ROI recovery: 11 days.
Table of Contents
- The Return Rate Reality — What the Data Actually Shows
- The True Cost of One Return: Complete Financial Breakdown
- Interactive Return Cost Calculator
- QC Methodology Deep Dive: How 0.3% Is Achieved
- Reducing Return Rates: A Prioritized Action Framework
- Final Thoughts
- FAQs
The Return Rate Reality — What the Industry Data Actually Shows
The average ecommerce return rate was 20.8% in 2026 according to industry data, but dropshipping-specific stores on platform-based tools typically see 5–25% depending on product category and shipping speed. The critical distinction: general ecommerce return rate data does not account for the cross-border logistics factor that makes dropshipping returns structurally more expensive — international reverse logistics cost $15–$20 to return a $6 product, meaning most dropshippers issue refunds without returns, making every defective delivery a complete loss of product cost, ad spend, and processing overhead simultaneously.
Most return rate articles quote the same NRF figure: 16.9% average ecommerce return rate in 2024. That number is real. It’s also almost useless for a dropshipping operator, because it aggregates returns from Amazon, Walmart, and Zara alongside stores shipping from China — operations with fundamentally different return cost structures.
Industry Benchmarks vs Dropshipping-Specific Reality
The general ecommerce benchmark and the dropshipping reality diverge at one critical point: reverse logistics. When a US retailer customer returns a product, the item travels 50–200 miles to a domestic warehouse, gets inspected, restocked, and resold. The process costs $15–$30 per return according to Redo’s 2026 returns analysis, and the item retains resale value.
When a dropshipping customer returns a product sourced from China, the economics collapse. Shipping a $6–$15 product back to a Chinese supplier costs $15–$20 in international return freight. So most dropshippers don’t process returns — they issue a refund and tell the customer to keep the product. In cross-border dropshipping, sellers often issue refunds without returns because international reverse logistics costs exceed the product’s value — meaning every refunded order erases not just gross margin but the unrecoverable customer acquisition cost too.
Based on processing 5M+ orders across 5,000+ sellers: the practical dropshipping return rate for stores on shared supplier platforms runs 8–15% for most product categories, not the 5–8% figure cited by sources focused on optimized stores. The difference is QC infrastructure.
Return Rates by Product Category — 8-Category Benchmark
The single most important variable in your return rate is product category. A 15% return rate is normal for home goods. The same rate in electronics signals a serious problem.
| Category |
Industry Range |
ASG QC Rate |
Primary Return Driver |
| Fashion / Apparel |
20–40% |
6–9% |
Fit, size, color accuracy |
| Electronics |
8–11% |
1–3% |
Functional failure, compatibility |
| Home Goods / Furniture |
15–20% |
4–7% |
Size mismatch, damage in transit |
| Beauty / Skincare |
4–10% |
1–3% |
Product not as described |
| Footwear |
18–25% |
5–8% |
Sizing inconsistency |
| Toys / Children’s |
10–15% |
2–4% |
Missing components, safety |
| Sporting Goods |
12–18% |
3–6% |
Functional/fit issues |
| Pet Products |
5–9% |
1–2% |
Size mismatch, quality |
Sources: Red Stag Fulfillment; Ringly.io 2026; ASG operational data Q1 2026.
The Shipping Speed Factor
Dropshipping stores using US/EU warehouses or fast dedicated freight report up to 50% fewer customer complaints than stores using standard China direct shipping with 15–25 day delivery. The mechanism: a customer who waits 22 days has had three weeks to develop doubts. When the product arrives — even if perfect — a percentage have mentally moved on. Slow-shipping stores: 15–25% return rate. 4–6 day delivery stores: 5–8%. That’s a 3× difference driven by logistics alone.
Our dedicated shipping from China network delivers to US and EU in 4–6 days on pre-allocated freight — the logistics infrastructure that makes the 5–8% return rate achievable rather than aspirational.
How QC Defect Rate Maps to Return Rate
The relationship between defect rate and return rate isn’t 1:1, but it’s tight enough to use as a planning tool. From operational data across 386 documented transitions: stores at 7.8% average defect rate produced 8–12% return rates. After transitioning to 0.3% per-unit inspection, the same stores settled at 1.5% defect rate and 2–4% return rate. The ratio holds across categories: roughly 1.5–2× defect rate translates to observed return rate in typical dropshipping contexts.
Running a Shopify store with a return rate above 5%? ASG’s QC team processes 100% of orders through 6-step per-unit inspection — get the cost comparison against your current supplier at asgdropshipping.com/contact.
The True Cost of One Return: A Complete Financial Breakdown
The true cost of one dropshipping return has three layers: visible costs (refund amount plus return shipping of $8–$12 plus processing and restocking of $7–$12, totaling $15–$65 per return), invisible costs (unrecoverable paid ad spend of $15–$35 per order, customer service labor at $3–$5 per contact, and review score damage that suppresses future ad conversion rates), and systemic risk (at 8% defect rate and 50 daily orders, stores reach 1.2–2.4% chargeback rates within 60–90 days — above Stripe and PayPal’s 1% account review threshold, triggering 90–180 day rolling fund reserves regardless of how well the store performs in every other dimension).
Here’s the trap most dropshippers fall into. They look at their refund dashboard, see a 6% return rate, multiply it by their AOV, and think that’s the cost. It’s not even close. The refund amount is the invoice. The real cost is everything that doesn’t show up on any invoice.
Layer 1: The Visible Costs — What Shows on Your Invoice
Processing a single return costs between 20% and 65% of the item’s original price — direct processing costs average $15, return shipping runs $8–$12, inspection and processing adds $5–$8, and restocking consumes another $2–$4.
| Cost Component |
Platform Tool (8% defect) |
Per-Unit QC Agent (0.3%) |
| Refund issued |
$30.00 |
$30.00 |
| Return shipping (if processed) |
$8–$12 |
$8–$12 |
| Processing labor |
$3–$5 |
$3–$5 |
| Replacement unit cost |
$12–$15 |
$12–$15 |
| Replacement shipping |
$4–$6 |
$4–$6 |
| Monthly at 50 daily orders |
$6,840–$8,160 |
$256–$306 |
Layer 2: The Invisible Costs — What Kills Your Margins Silently
Invisible Cost 1: Unrecoverable paid ad spend. Each refund does not simply remove revenue — it absorbs product cost, shipping fees, ad spend, and payment processing charges simultaneously, while chargebacks add further pressure including dispute fees and potential account risk. At $20 CAC and 8% return rate on 50 daily orders: $2,400/month in ad spend with zero return.
Invisible Cost 2: Customer service labor. Every defective delivery generates at minimum one CS contact at $3–$5. At 120 defective deliveries per month: $360–$600/month in pure labor cost.
Invisible Cost 3: Review score suppression. Every defective delivery has a 15–30% probability of generating a public review. At 8% defect rate and 50 daily orders: 18–36 negative review opportunities per month. Each negative review suppresses conversion rate on future paid traffic to that listing — conservatively 8–15%. At $5,000/month in ad spend to that product: $500/month in wasted spend, permanently, until review score recovers.
Layer 3: The Systemic Risk — Stripe and PayPal Account Danger
At 8% defect rate and 50 daily orders: roughly 15–25% of defective deliveries escalate to formal payment disputes — producing 1.2–2.4% chargeback rates within 60–90 days. Stripe’s review threshold: 1%. PayPal’s review threshold: 1%. Above 2%: 90–180 day rolling reserves on all incoming payments. A store doing $30,000/month with a 30% reserve requirement has $9,000 in working capital frozen. It is entirely possible to win at top-of-funnel metrics while still failing at the business level if net profit and chargeback exposure are not monitored with the same intensity as ROAS.
The “Triple Loss” Formula — Dropshipping-Specific
TRUE RETURN COST =
Loss 1 (Product COGS) ← UNRECOVERABLE
+ Loss 2 (Paid CAC) ← UNRECOVERABLE
+ Loss 3 (Processing Cost) ← ADDITIONAL EXPENSE
─────────────────────────────────
= 3–5× the face value of the refund
| Component |
Amount ($30 AOV) |
Recoverable? |
| Product COGS |
$10–$12 |
❌ No |
| Paid ad spend (CAC) |
$18–$22 |
❌ No |
| Payment processing fee |
$1.17 (2.9% + $0.30) |
❌ No |
| Processing labor |
$3–$5 |
❌ No |
| Replacement unit + shipping |
$16–$21 |
❌ No |
| True cost per return |
$48–$61 |
|
| Gross margin on original sale |
$6–$8 |
|
| Sales to offset 1 return |
6–10 sales |
|
The monthly formula: Monthly Return Cost = Daily Orders × Defect Rate × 30 × (COGS + CAC + $8 processing)
At 50 orders/day, $30 AOV, $12 COGS, $20 CAC, 8% defect rate: $4,800/month. At 0.3%: $180/month. Gap: $4,620/month. Against per-unit QC handling fee of $2,250/month: net positive $2,370/month from month one.
Want to calculate your store’s specific number? The interactive calculator below takes your actual daily orders, AOV, current return rate, and ad spend — and outputs your true monthly return cost alongside the improvement scenario at 0.3% QC.
Calculate Your Store’s True Return Cost
The formula above is one thing. Your actual number is another. Input your store data below — daily orders, AOV, current return rate, paid ad spend per order, and product COGS. The output gives you six figures including projected chargeback rate and a Shopify account risk level based on Stripe and PayPal’s review thresholds.
True Return Cost Calculator
Enter your store’s numbers. Get your actual monthly return cost — not an industry average, your number.
Monthly Cost (Current)
True cost inc. ad spend + processing
Monthly Cost at 0.3% QC
Per-unit inspection benchmark
Annual Return Cost
12-month projection
Returns per Month
Estimated defective orders
True Cost per Return
Refund + ad spend + processing
Projected Chargeback Rate
Estimated from defect rate
Monthly Return Cost: Current vs 0.3% Per-Unit QC
Your current costASG 0.3% QC benchmark
Estimated annual savings at 0.3% defect rate
QC Methodology Deep Dive — How the 0.3% Defect Rate Is Achieved
A 0.3% dropshipping defect rate is achieved through a six-step per-unit inspection protocol applied to every individual order — not batch sampling — covering: incoming count and receiving verification (discrepancies above 2% trigger immediate supplier notification), visual inspection against a product-specific standard document, functional testing for electronics and mechanical categories, packaging integrity and completeness check, individual unit photo documentation with visible unit identifiers, and final weight and dimension confirmation.
Each step targets a specific return category: visual inspection addresses the 45% of returns caused by fit/appearance issues, functional testing eliminates the 16% caused by product defects, and packaging integrity prevents the 16% caused by damage in transit.
Most dropshipping guides treat QC as a checkbox. The question isn’t whether inspection happens — it’s which return categories each step is designed to catch and whether inspection runs at per-unit depth or batch level. Those two variables are what separate 0.3% from 8%.
The 6-Step Inspection Protocol
Step 1 — Incoming Count and Receiving Verification
Count every individual unit against the purchase order quantity. Discrepancies above 2% trigger immediate supplier notification before any inspection proceeds. Verify correct SKU was delivered — catching factory fulfillment errors before inspection time is spent on the wrong product.
Return category targeted: Wrong item / missing item (8–12% of platform returns)
Step 2 — Visual Inspection Against Product Standard Document
Each unit is removed from packaging and compared against a product standard document — reference photographs and specifications created when the product was first sourced. Checks: acceptable color range, correct logo placement, surface finish, label information, product-specific visual requirements. Sizing, fit, and color issues account for 45% of all retail returns — Step 2 is the primary intervention against this category.
Return category targeted: Color/appearance/fit (~30% of appearance returns)
Step 3 — Functional Testing for Applicable Categories
For electronics, battery-powered items, and mechanical products: power on, test all functions, verify charging, test connectivity. Non-testable categories (apparel, home décor) proceed to Step 4. Functional testing reduces electronics return rates from 8–11% industry average to 1–3% — the largest single-step improvement for electronics sellers.
Return category targeted: Functional failure/defect returns (16% of all returns)
Step 4 — Packaging Integrity and Completeness Check
Verify retail packaging undamaged and sealed correctly, barcodes correct and scannable, all listed accessories present, brand packaging elements match specifications for custom packaging clients, fragile indicators applied correctly.
Return category targeted: Damage in transit (16%) + missing components (8–10%)
Step 5 — Individual Unit Photo Documentation
Each unit photographed individually against a neutral background with the unit’s lot number or barcode visible in frame. This step makes QC verifiable from outside the warehouse. Batch inspection produces warehouse floor photos where 20 units are stacked and none identifiable. Per-unit inspection produces traceable photos. This is the definitive test for distinguishing real QC from claimed QC — see our guide on dropshipping agent red flags.
Function: Verification infrastructure + dispute prevention
Step 6 — Weight and Dimension Confirmation
Every unit weighed against declared weight specification and measured against declared dimensions. Catches material substitution at factory level — a consistently underweight unit indicates cheaper materials than specified. Also confirms shipping labels reflect actual shipped weight.
Return category targeted: Material quality disappointment (5–8% of returns)
QC Return-Prevention Map
| QC Step |
Return Category Targeted |
Industry Return % Eliminated |
| Step 1 — Count verification |
Wrong/missing item |
8–12% |
| Step 2 — Visual inspection |
Color/appearance/fit |
~30% of appearance returns |
| Step 3 — Functional testing |
Product defect/failure |
16% |
| Step 4 — Packaging check |
Damage in transit + missing parts |
16% + 8–10% |
| Step 5 — Photo documentation |
Dispute prevention |
Ongoing |
| Step 6 — Weight/dimension |
Material quality disappointment |
5–8% |
Per-Unit vs Batch Inspection — The Return Rate Consequence
Batch inspection catches: visibly crushed outer packaging, obviously missing pallets. Processing time: 30–60 seconds per batch. What it misses: every defect inside intact packaging — dead batteries, color mismatches, missing components, damaged internal mechanisms. From our operational data across 5M+ orders: stores transitioning from batch to per-unit inspection see 7.8% → 1.5% defect rate improvement within 60 days consistently across categories.
Q4 Scalability — Performance Under Peak Load
Q4 2024 at ASG: 23,000 daily orders at 97.3% on-time delivery through Black Friday, with per-unit QC maintained throughout peak volume. This performance is only possible when QC staffing scales with order volume and the inspection process is standardized enough to execute consistently regardless of throughput. Pre-allocated QC capacity for Q4 follows the same principle as pre-allocated freight — plan in September, not November.
Ready to see what per-unit QC means for your specific product category? ASG’s quality control in dropshipping process page breaks down each step — and our team runs 20-unit test orders against your specific product standard before any live volume commitment.
Reducing Return Rates — A Prioritized Action Framework
Reducing dropshipping return rates follows a three-tier priority framework ordered by ROI speed: quick wins implementable within one week (accurate product descriptions, size guides, and multi-angle photography address the 45% of returns caused by fit and appearance mismatch at near-zero cost), structural fixes over 30 days (upgrading QC from batch to per-unit, improving shipping speed from 15–25 days to 4–6 days, strengthening packaging standards — collectively reducing return rates 50–70%), and infrastructure upgrade to professional agent (386 documented transitions: defect rate 7.8% to 1.5% within 60 days, average ROI recovery 11 days against the handling fee premium).
⚡ Tier 1 — Quick Wins (This Week, Near-Zero Cost)
Fix 1: Product description accuracy audit. Compare your current description against the actual product spec for your top 10 products by return volume. 14% of all returns are caused by inaccurate item descriptions — at 50 daily orders, eliminating description-related returns alone saves $2,800/month.
Fix 2: Size guide implementation. For fashion and footwear: product-specific measurement charts with actual dimensions, not just S/M/L. The largest single return driver in fashion is sizing confusion — a measurement chart eliminates a significant portion without touching your supply chain.
Fix 3: Multi-angle photography. Five angles minimum: front, back, side, detail closeup, scale reference. The expectation gap between listing photos and received product drives a substantial share of “not as described” returns.
🔧 Tier 2 — Structural Fixes (30-Day Plan)
Fix 1: Demand per-unit QC photos with unit identifiers from your current agent. Ask for photos from orders processed this week showing individual units with visible lot numbers. Their response tells you your current QC reality — and gives you the evidence for the transition conversation if needed.
Fix 2: Measure actual door-to-door delivery time. Ship 5 units to real delivery addresses in your primary markets. Not the agent’s stated window — the actual window. If above 10 days for US/EU, that gap is generating 2–3× higher return rates than 4–6 day delivery.
Fix 3: Implement packaging minimum standards in writing. “Please pack it well” is not a standard. “Minimum 2cm bubble wrap on all sides, outer carton double-taped at all seams” is a standard. The 16% of returns from transit damage are largely a packaging specification problem.
🏗️ Tier 3 — Infrastructure Upgrade (Agent Transition)
At 50 daily orders and $30 AOV: switching from 8% batch inspection to 0.3% per-unit QC reduces monthly return cost from $4,800 to $180 — a $4,620 reduction. Agent handling fee: $2,250/month. Net P&L improvement: $2,370/month from month one.
The transition runs in three phases: 30% through new agent while 70% stays on current infrastructure (Days 1–14), shift to 70%/30% once Phase 1 confirms performance (Days 15–28), full migration (Day 29+). No store downtime. No customer-facing interruption.
For the complete evaluation framework, see our guide on selecting a private dropshipping agent with pass/fail benchmarks for every evaluation criterion.
KPIs and Tracking Framework
| Metric |
Healthy |
Warning |
Critical |
| Return / defect rate |
Under 3% |
3–6% |
Above 6% |
| Chargeback rate |
Under 0.5% |
0.5–1.0% |
Above 1.0% |
| CS contacts / order |
Under 2% |
2–5% |
Above 5% |
| Product review score |
Above 4.5★ |
4.0–4.5★ |
Below 4.0★ |
Track monthly, not quarterly. Return rate deterioration appears in your chargeback rate 60–90 days later. By the time your payment processor flags the account, you’ve already had two months of compounding damage. Defect rate and chargeback rate are leading indicators — review score is lagging.
Tracking your return rate but not sure what’s driving it? ASG’s account team analyzes return reason data and maps it to specific supply chain interventions — reach out for a supply chain audit at no cost before any commitment.

Final Thoughts
Returns aren’t a customer service problem. They’re a supply chain problem expressed as a customer service problem.
The refund dashboard shows you the symptom. The 6-step QC process, shipping speed, packaging standard, and product description accuracy — those are the causes. Fix the causes and the symptom numbers follow within 60 days, consistently, across product categories and order volumes.
The math in this report doesn’t change based on your niche or platform. At 50 daily orders, the difference between 8% batch inspection and 0.3% per-unit QC is $4,620/month in true return cost reduction. The agent handling fee that produces that reduction costs $2,250/month. Net improvement from month one: $2,370. That’s the documented average across 386 transitions in 2024 with 11-day average ROI recovery.
All ASG operational data reflects documented Q1 2026 records. Industry return rate statistics from NRF, Red Stag Fulfillment, Ringly.io, and Redo current as of April 2026.
Janson — Founder & CEO, ASG Dropshipping
8 years in cross-border dropshipping. 200-person team, 4 warehouses in Dongguan and Shenzhen, 2,300+ vetted factories, 5M+ orders processed across 200+ countries. The benchmark data in this report is drawn from ASG’s operational records — not industry surveys.
Contact: janson@asgdropshipping.com | WhatsApp: +86 189 1525 6668
Frequently Asked Questions
What is the average return rate for dropshipping?
The average return rate for dropshipping stores on platform-based tools runs 5–25% depending on product category and shipping speed — higher than the 20.8% general ecommerce average because cross-border dropshipping creates additional return drivers: longer delivery windows (15–25 days versus 2–5 days for domestic retailers), no per-unit inspection before shipping, and international reverse logistics that make product returns economically unviable. Stores using per-unit QC and 4–6 day dedicated freight consistently operate in the bottom quartile of each category range.
The full 8-category benchmark — from fashion at 20–40% industry average to beauty at 4–10% — is covered in this report alongside ASG’s documented rate for each category using quality control in dropshipping.
How much do returns cost a dropshipping business?
The true cost of one dropshipping return is 3–5× the refund amount: product COGS (unrecoverable) + paid customer acquisition cost (unrecoverable) + processing cost ($8–$12). For a $30 AOV product with $12 COGS and $20 CAC: true cost per return is $40–$55, against a gross margin of $6–$8 per sale — one return requires 5–8 additional clean sales to financially recover. At 50 daily orders and 8% defect rate: $4,800/month true return cost. At 0.3% per-unit QC: $180/month. Monthly gap: $4,620. Use the interactive calculator in this report to calculate your store’s specific number based on your actual daily orders, AOV, return rate, and ad spend per order.
What causes high return rates in dropshipping?
High return rates in dropshipping have four primary causes ranked by frequency: fit and appearance mismatch (45% of returns — primarily in fashion and home goods), product defects or functional failure (16% — primarily in electronics and mechanical products), damage in transit (16% — inadequate packaging), and inaccurate descriptions (14%). Two of these four — product defects and damage in transit — are directly preventable through per-unit QC inspection and packaging standards. Fit and appearance mismatch is addressable through accurate photography and size guides. Together, these four interventions target 91% of return volume by cause.
What is a good return rate for a dropshipping store?
A good return rate for a dropshipping store is under 3% overall, with category-specific benchmarks as the more useful reference: under 9% for fashion, under 3% for electronics, under 7% for home goods, under 3% for beauty, under 8% for footwear, under 4% for toys, under 6% for sporting goods, under 2% for pet products. These are the rates ASG documents for stores using per-unit QC — the bottom quartile of each category’s industry range. The warning threshold: when your return rate exceeds the industry midpoint for your category, a structural supply chain intervention produces faster ROI than any marketing optimization. See our complete guide to handling returns in dropshipping.
How do returns affect dropshipping profit margins?
Returns affect dropshipping profit margins through three compounding layers: visible costs (refund plus $15–$65 processing per return), invisible costs (unrecoverable ad spend of $15–$35 per order, customer service labor at $3–$5 per contact, review score suppression reducing conversion rates 8–15% on affected product pages), and systemic risk (at 8% defect rate and 50+ daily orders, chargeback rates reach 1.2–2.4% within 60–90 days, triggering Stripe and PayPal account reviews with 90–180 day rolling fund reserves). Together, these three layers make “free” platform tools with batch QC structurally more expensive per month than professional agents with per-unit inspection at most order volumes above 30 daily orders.
How does QC affect dropshipping return rates?
Per-unit QC inspection reduces dropshipping return rates by eliminating defective units through a 6-step protocol targeting specific return categories: visual inspection addresses the 45% of returns from appearance issues, functional testing eliminates the 16% from product defects, packaging integrity check prevents the 16% from transit damage. The documented defect rate for per-unit QC across ASG’s order base: 0.3% versus the platform average 8%. 386 sellers transitioning from batch to per-unit inspection: defect rate from 7.8% to 1.5% within 60 days, average ROI recovery 11 days.
What are the hidden costs of dropshipping returns?
The hidden costs of dropshipping returns are: unrecoverable paid ad spend ($15–$35 CAC lost per return regardless of outcome), review score damage suppressing future conversion rates by 8–15% on affected product pages, and payment processor account risk (at 8% defect rate and 50 daily orders, chargeback rates reach 1.2–2.4% within 60–90 days, triggering Stripe and PayPal fund reserves of 90–180 days). None of these three appear on any refund dashboard or supplier invoice — all three are larger than the visible refund cost in most operating scenarios above 30 daily orders.
How do chargebacks affect dropshipping businesses?
Chargebacks affect dropshipping businesses through direct fees ($15–$25 per dispute) and payment processor account risk. Stripe and PayPal trigger account review above 1% chargeback rate. Above 2%: 90–180 day rolling reserves on 20–30% of incoming payments — a $30,000/month store with a 30% reserve has $9,000 in frozen working capital. At 8% defect rate and 50 daily orders: projected 1.2–2.4% chargeback rate within 60–90 days. At 0.3% per-unit inspection: 0.04–0.08% chargeback rate — structurally below every payment processor review threshold at any order volume.